# A list containing dictionaries for each specialty
specialties = [
{
"name": "Automated Database Architecture Sharding",
"category": "Database Engineering"
},
{
"name": "Multi-Tenant Middleware Networks",
"category": "Networking & Infrastructure"
},
{
"name": "DevNet",
"category": "Network Automation"
},
{
"name": "Network Automation",
"category": "Network Automation"
},
{
"name": "Python",
"category": "Programming Languages"
},
{
"name": "Premium Scalable Solutions",
"category": "System Architecture"
}
]
# Loop through the list to display the arranged data
for item in specialties:
print(f"[{item['category']}] -> {item['name']}")

Specializing in automated database architecture sharding, multi-tenant middleware networks, Devenet, Network Authoomation ,python and premium scalable solutions.
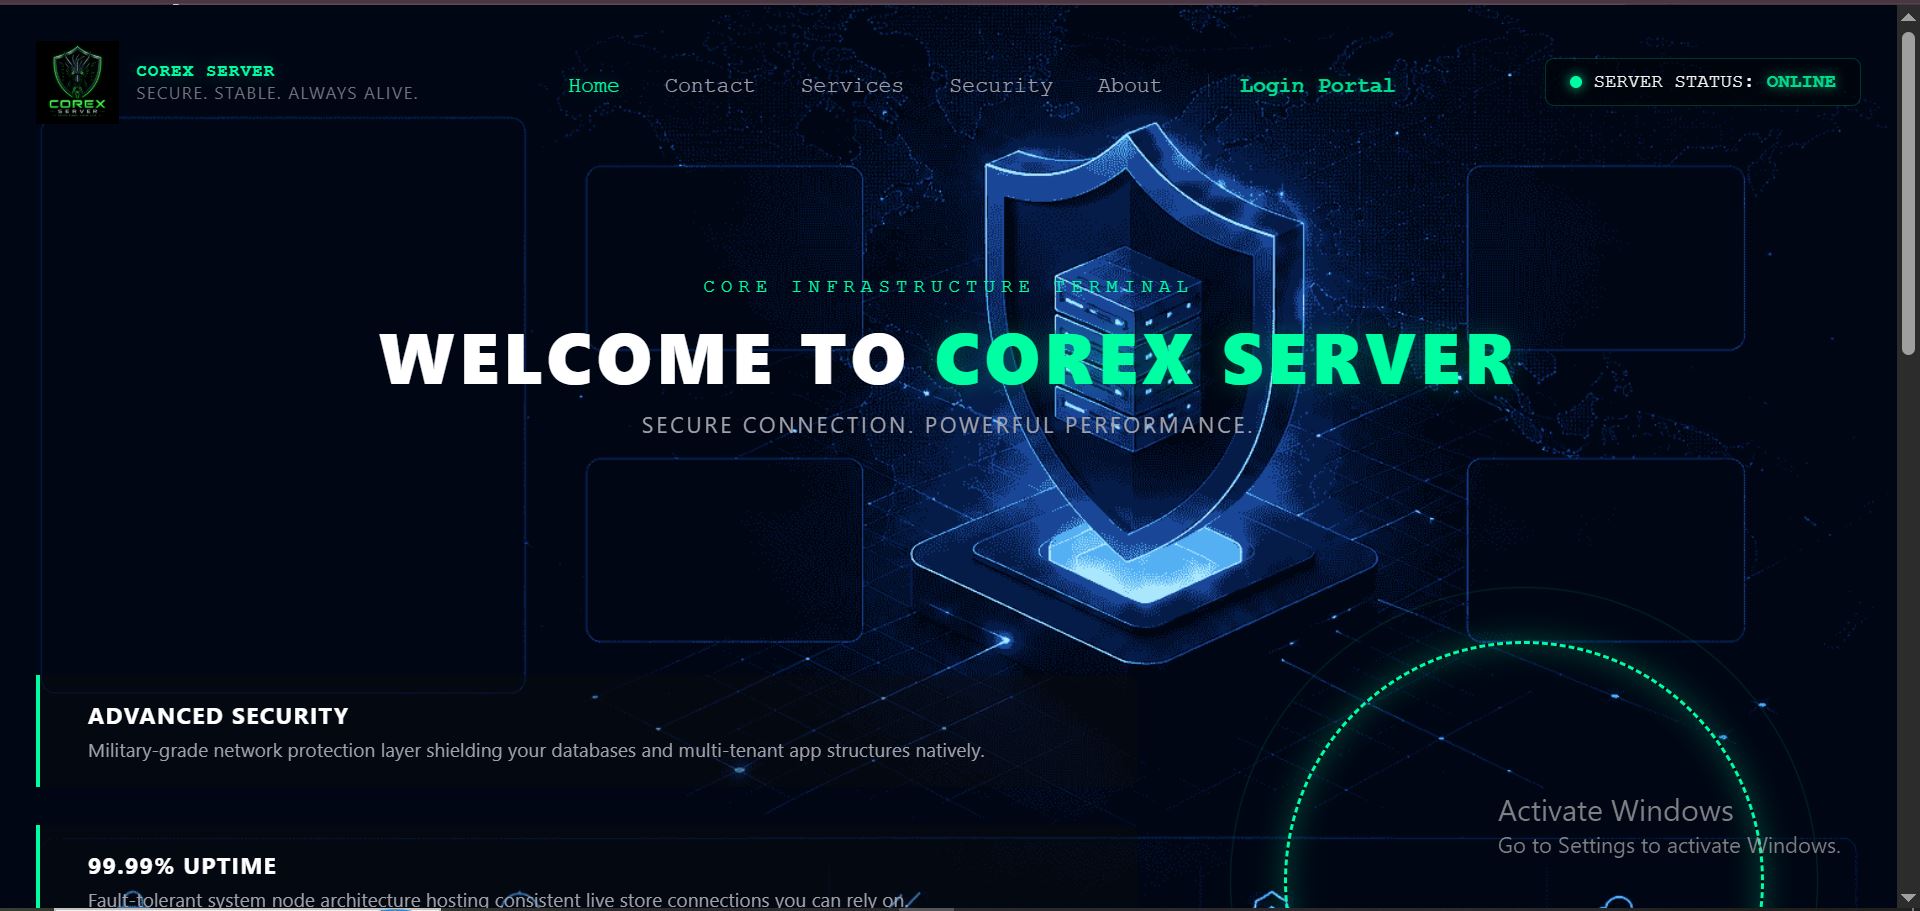
Description: COREX is a SaaS platform I developed to help small and medium businesses in Nigeria get online quickly. It allows agents and business owners to create, manage, and host professional business websites with monthly subscription tracking. Key Features: - Automated website creation and deployment - Agent commission & subscription management system - Client billing and hosting management (₦10,000/mo model) - Secure agent portal with role-based access Tech Stack: [Put your stack here e.g., PHP / Laravel, MySQL, JavaScript, cPanel API etc] Role: Founder & Full-Stack Developer
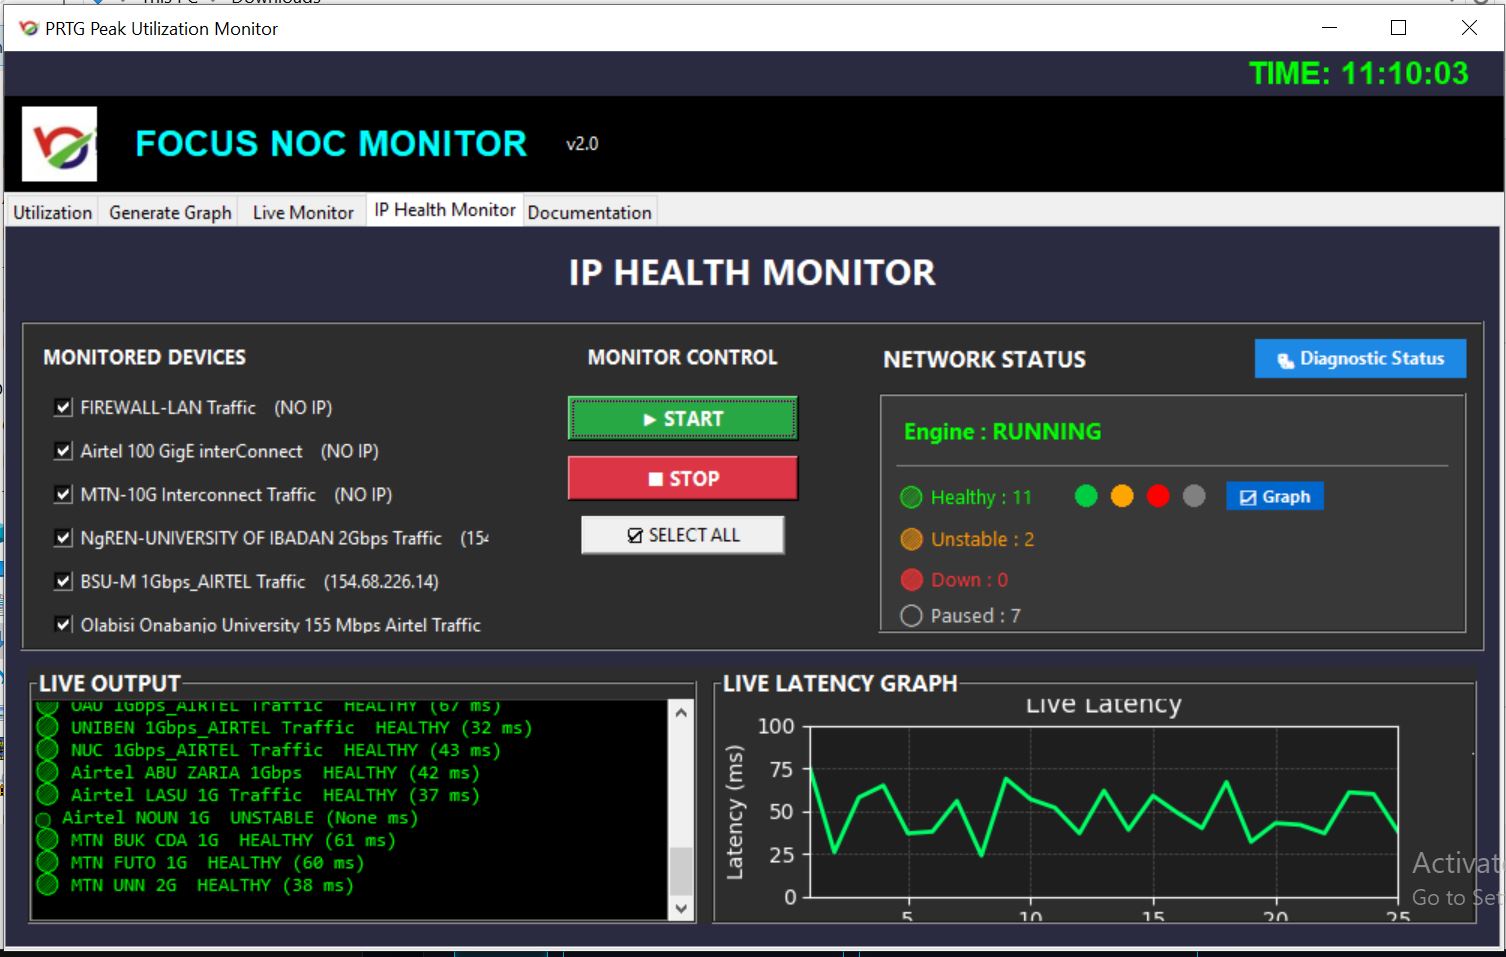
Network Monitoring & Reporting Automation System PRTG Focus is a Python-based network monitoring and reporting system designed to simplify and automate the monitoring of corporate network links through PRTG Network Monitor. The system provides a centralized interface for monitoring network sensors, checking link availability and utilization, analyzing traffic performance, and generating professional reports. It reduces the need for manually checking PRTG graphs, calculating peak bandwidth, recording data in Excel, taking screenshots, and preparing reports for clients. Key features -Real-time PRTG monitoring of network sensors and links -Automatic bandwidth conversion and calculation to display utilization accurately in Mbps -Live connectivity testing / ping monitoring -Daily, weekly, and monthly utilization analysis -Automatic peak utilization detection -PRTG graph export to PDF -Dynamic traffic graphs for different monitoring periods -Network-down / link-status monitoring -Automated client reporting -Email and WhatsApp reporting integration -Configurable sensor, capacity, email, and PRTG settings -JSON-based configuration instead of hard-coded credentials -Tkinter-based desktop GUI -Designed to reduce repetitive manual network-monitoring and reporting tasks